Grader Than Workspace
A Grader Than Workspace is a fully configured computer that runs right in your browser, equipped with all the programming tools you'll need. It includes the Grader Than IDE, a programming environment built on top of VS Code. This means you can build anything—there are no limitations to what you can create.
In addition to the IDE, you can also access a virtual Desktop, which allows you to run and interact with graphical applications like video games and more.
Run your code
In this section, we will discuss how to run your code in the Grader Than IDE. Start by opening your classroom page, then do one of the following options:
-
Open the IDE:


- From your classroom page, click the IDE button in the upper left corner.
-
Wait for the workspace to start:
- It may take around 30 seconds for the workspace to fully start up.
-
Create a new file:


- Once the workspace is ready, right-click on any blank space on the left side of the screen (in the file explorer).
- From the menu that appears, select New File.
- Name the file something simple, like
main.py, and press Enter.
-
Write your Python code:


- Your new file will open in the main editor window.
- Type the following Python program into the file:
-
Run the code:
You have two ways to run your Python program:
-
Option 1: Click the play button

 in the top right corner of the screen.
 -
Option 2: Right-click on any blank space in the text editor. In the menu that appears press the Run Code option at the top of the menu.
-
-
View the output:
The output, which should say "Hello, World!", will appear at the bottom of the screen in the terminal.
-
Open the IDE:
- From your classroom page, click the IDE button in the upper left corner.
-
Wait for the workspace to start:
- It may take around 30 seconds for the workspace to fully start up.
-
Create a new file:


- Once the workspace is ready, right-click on any blank space on the left side of the screen (in the file explorer).
- From the menu that appears, choose New Java File.
- In the submenu that appears select Class...
- A text input will appear in th top middle of your screen.
- Name your file something simple, like
Main.java, and press Enter.
-
Write your Java code:


- Your new file will open in the main editor window.
- Type the following basic Java program into the file:
-
Run the code:
You have two ways to run your Java program:
-
Option 1: Click the Run button that appears above the
public static void main()function. -
Option 2: Click the play button
in the top right corner of the screen. -
Option 3: Right-click on any blank space in the text editor. In the menu that appears select Run Java toward the bottom of the menu.
- More details on running Java Applications.
-
-
View the output:
The output, which should say "Hello, World!", will appear at the bottom of the screen in the terminal.
Troubleshooting: Code won't run?
First, please double-check that your code is free of any syntax errors. Make sure there are no red lines in the code.
Before running your Java code, make sure you see "Java: ready" in the bottom bar of your screen.
-
At first, you might see "Java: Activating":
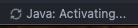
-
Wait for it to change to "Java: ready":

If Java needs to restart, you'll see a notification like this at the bottom right of the screen. Simply click Reload and everything should resolve itself shortly.
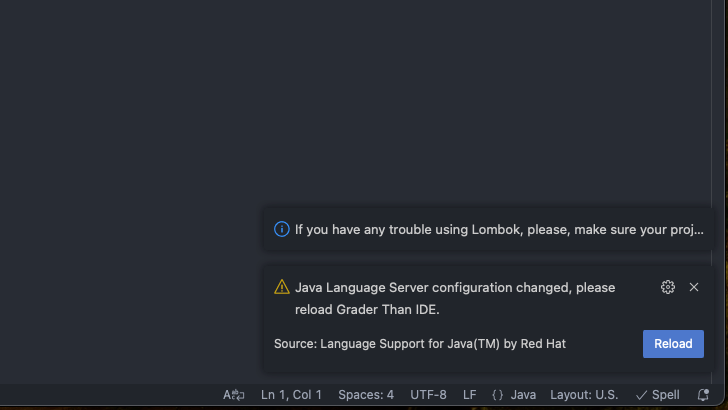
If all else fails, try refreshing the browser page.
-
-
Open the IDE:
- From your classroom page, click the IDE button in the upper left corner.
-
Wait for the workspace to start:
- It may take around 30 seconds for the workspace to fully start up.
-
Create a new file:
- Once the workspace is ready, right-click on any blank space on the left side of the screen (in the file explorer).
- From the menu that appears, select New File.
- Name the file something simple, like
main.js, and press Enter.
-
Write your JavaScript code:


- Your new file will open in the main editor window.
- Type the following JavaScript program into the file:
-
Run the code:
You have two ways to run your JavaScript program:
-
Option 1: Click the play button
in the top right corner of the screen. -
Option 2: Right-click on any blank space in the text editor. In the menu that appears, press the Run Code option at the top of the menu.
-
-
View the output:
The output, which should say "Hello, World!", will appear at the bottom of the screen in the terminal.
-
Open the IDE:
- From your classroom page, click the IDE button in the upper left corner.
-
Wait for the workspace to start:
- It may take around 30 seconds for the workspace to fully start up.
-
Create a new file in the
srcfolder:

- On the left side of the screen (in the file explorer), locate the
srcfolder. - Right-click on the
srcfolder and select New Folder from the menu. - Name the file something simple, like
HelloWorldApp, and press Enter. - Right-click on the folder you just created and select New File from the menu.
- Name the file something simple, like
main.cpp, and press Enter.
Each app must be in its own folder
Every C++ application must be contained in its own folder. Specifically, no two
.cppfiles can have amain()function in the same folder. This is why we created theHelloWorldAppfolder and placed themain.cppfile inside it, to avoid conflicts with the existingwelcome.cppapplication. - On the left side of the screen (in the file explorer), locate the
-
Write your C++ code:


- Your new file will open in the main editor window.
- Type the following C++ program into the file:
Use shortcuts to get started
After creating your C++ file, type
cppin the file's text editor. A list of shortcuts will appear—select the optioncpp-app-simple. This will automatically insert much of the boilerplate code you need to get started. -
Run the code:
You have two ways to run your C++ program:
-
Option 1: Click the play button
in the top right corner of the screen. -
Option 2: Right-click on any blank space in the text editor. In the menu that appears, press the Run Code option at the top of the menu.
-
-
View the output:
The output, which should say "Hello, World!", will appear at the bottom of the screen in the terminal.
-
Open the IDE:
- From your classroom page, click the IDE button in the upper left corner.
-
Wait for the workspace to start:
- It may take around 30 seconds for the workspace to fully start up.
-
Create a new file:
- Once the workspace is ready, right-click on any blank space on the left side of the screen (in the file explorer).
- From the menu that appears, select New File.
- Name the file something simple, like
query.sql, and press Enter.
-
Write your SQL code:
- Your new file will open in the main editor window.
- Type the following SQL query into the file:
-
Run the code:
You have two ways to run your SQL query:
-
Option 1: Click the play button
in the top right corner of the screen. -
Option 2: Right-click on any blank space in the text editor. In the menu that appears, click the second option named Run All SQL.
-
The Grader Than Workspace is versatile and can run almost any programming language. For languages not covered in our tutorials, be sure to check the language-specific instructions on their official home page. To make running code simpler across languages, we recommend installing the Code Runner extension in your workspace. This allows you to use the play button to automatically run your code with ease.
Web Development
With Grader Than, building a simple website is fast and easy. In just a few steps, you’ll have your own website up and running using HTML, CSS, and JS. Follow this guide, and you’ll be previewing your web page in no time!
Create A Project
This section will guide you through how to create a web preview project. Follow this tutorial if you would like to create a new web preview project. If you already have an existing project, follow the Open Existing Project tutorial.
-
Open the command pallet:
-
Open the command pallet by pressing the search text field in the top middle of the screen. You can use this the search for files and run commands. To run a command, when the dropdown appears type
>to activate the command pallet. -
In the command palette, type
> web preview: new projectand select it. Remember the>symbol at the beginning of the command is important.
Pro Tip: Use keycommands to open the command pallet faster!
Press the keys below at the same time to open the command pallet:
Cmd+Shift+P
Ctrl+Shift+P
Ctrl+Shift+P
-
-
Name your project:
- Give your project a name (remember, no spaces!).
-
Select all file types:
-
When given the option to Include JS and Include CSS, make sure to include them all.
-
Setting up your project:
- After naming your project, four windows will appear in the middle of your screen. These are the files for your web project.
Writing HTML and CSS
-
Add HTML in the
index.htmlwindow:- Here’s a simple example:
-
Add CSS in the
style.csswindow:- Use this basic styling:
-
Preview your web page:
- As you make edits to your code all the changes will be instantly visible in the preview window.
Open Existing Project
If you already have a web preview project and you'd like to open it again, follow this tutorial.
-
Open the command palette:
- Open the command palette by clicking the search text field at the top center of the screen. You can use this to search for files and run commands. To run a command, type
>when the dropdown appears to activate the command palette. - In the command palette, type
> web preview: open projectand select it. Don’t forget the>symbol at the beginning of the command—it's important!
Pro Tip: Use shortcuts to open the command palette faster!
Press the following keys simultaneously to open the command palette:
Cmd+Shift+P
Ctrl+Shift+P
Ctrl+Shift+P
- Open the command palette by clicking the search text field at the top center of the screen. You can use this to search for files and run commands. To run a command, type
-
Type the name of your existing project:
- In the command palette, type the name of your existing project and press Enter.
Download a file
In this tutorial, we will discuss how to download a file from the Grader Than IDE. It is assumed you have already opened the Grader Than Workspace.
1) Locate the file in the file Explorer menu on the left side of the screen. If you do not see the Explorer menu, click the Explorer button 
 located in the activity bar in the left side of the screen.
2) Find the file in the Explorer menu.
3) Right click on the file’s name, then in the menu that appears, press the Download… option
If you cannot find the file in the Explorer menu
1) Click the Menu button 
 in the upper left corner of the screen.
2) In the menu that appears, click File → Open Folder
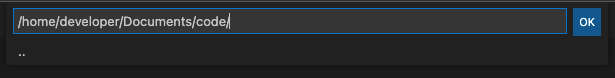
3) A menu will appear in the middle of the screen. Type in the directory where the file you’d like to download is located. Press the blue Ok button next to the text field.
4) Now you should see the file in the Explorer menu on the right side of the screen.
Upload a file
In this tutorial, we will discuss how to upload a file from the Grader Than IDE. It is assumed you have already opened the Grader Than Workspace.
1) On your local computer, locate the file you’d like to upload to your Grader Than Workspace.
2) Open your Grader Than IDE by following the instructions in the Accessing Your Grader Than Workspace section above.
3) Once your IDE is open, open the file explorer by clicking the Explorer button located in the activity bar in the left side of the screen.
4) To upload the file, drag and drop the file that you’d like to upload from your local computer, into the Grader Than IDE Explorer menu in the browser.
Saving your work
- Any file you create in the /home/developer/ directory will be saved automatically. Additionally, all changes you make to your files in the Grader Than IDE are automatically saved. If you close the Grader Than Workspace browser tabs and then come back later, all of your work is saved for you.
Only files saved in the directory /home/developer/ are saved.
You need to make sure all your files are saved inside of the /home/developer/ directory or else your work will be lost. Any files located outside of the /home/developer/ directory will be lost when the workspace restarts.
Java
In this section, we will discuss how to set up your Java development environment in the Grader Than Workspace IDE. Java is a special language because it requires a project in order to run your code. Without a Java project, you may have difficulty running your code. In this section we will learn:
Before you begin this tutorial, make sure you have completed the Grader Than Workspace Setup tutorial. It is assumed that you have a Grader Than account and you are enrolled in a course where your professor is working with Java.
Create Java Project
Typically, you will create one Java project for each course you are in. A Java project is a set of files and folders that holds your Java code. It also has a few more special files, that enable your computer to understand how to connect the java files together (to create a complete application).
To create a Java project do the following:
1) On the course page, open the Grader Than Workspace IDE by clicking the IDE button ![]()
![]() .
.
2) It may take approximately 30-40 seconds for your workspace to open. Once your workspace is open, open the command palette of the IDE by pressing the keys below at the same time:
Ctrl+Shift+P
Cmd+Shift+P
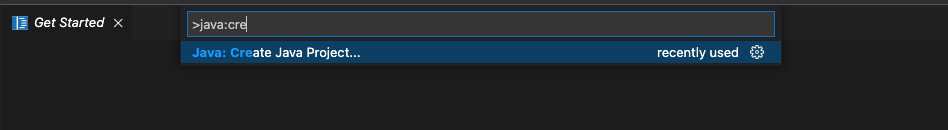
3) Now that the command palette is open (in the middle of the screen), type in the following command: Java:Create Java Project. Next, press Enter or click the highlighted command named Java:Create Java Project…
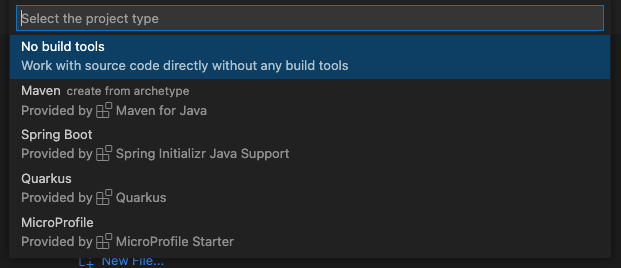
4) In the next section of the menu, click No build tools.
5) In the next section, it is asking you in which directory you’d like to create your Java project in. Select the default settings /home/developer/Documents/code/, then press the blue OK button.
Make sure you save the project in /home/developer/
If you desire to change the project location make sure you put it in a location under the /home/developer/ directory or else it will NOT be saved. In other words the path must start with /home/developer/ for the code to be saved.
6) Next, select a name for your new Java project. In this tutorial, we will call our project HelloWorld. Once you have selected a project name, press the Enter key on the keyboard.

After you have pressed Enter, a new tab should appear in your browser with the newly created project. You will notice on the left side of the screen in the Explorer menu, there are several new files and folders such as lib and src.
-
lib - This is where additional Java libraries are saved
-
src - This is where you should put your java code that you create for class. It is important to note that inside of this directory there is already a java file named App.java in the src folder.
-
App.java - is a pre-made example file that you can use to get started.
Congratulations on creating your first Java project! In the sections to follow, we will learn about how to run your Java Code.
Run Java Code
In this section, we will learn how to run our Java code. It is assumed that you have created a Java project already. If you do not have a Java Project, please follow the directions above, in the section named Create a Java Project.
1) In the newly created Java project open the file named App.java.
2) Once the file is open, you may notice a line of code that says the following:
This is known as the Main Function. It is critical for a Java application because it's the entry point into your java application. Without it, you cannot start your Java application.
3) You have 3 options to run your application:
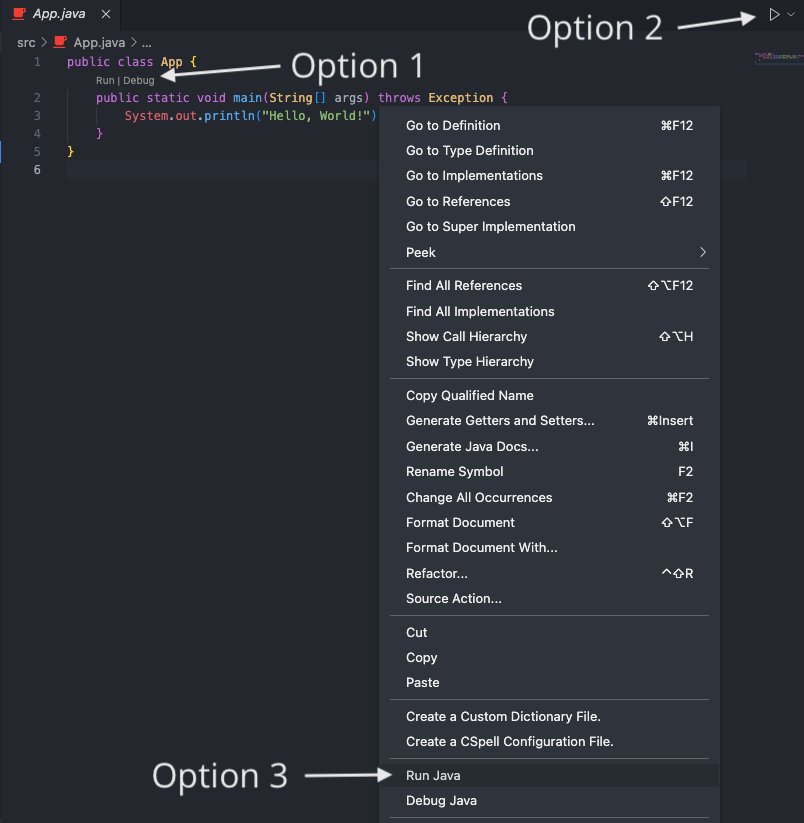
Option 1 - Click the Run button above the Main Function. In the text editor
Option 2 - Click the play button in the top right corner of the screen.
Option 3 - Right click on any blank space underneath your code. In the menu that appears, click the option named Run Java towards the bottom of the menu.
1) Give the computer a moment to compile the Java code. When the compilation is complete. The output of your application will be displayed in the terminal window at the bottom of the screen.
Great job! You have run your first Java application! You are now a Java Developer 
Debugging
In this tutorial, we will cover how to debug your application within your Grader Than Workspace IDE. This is important to know because eventually there will be an error in your code. Having the right tools to resolve this issue can go a long way.
In the directions we will be working with an application written in python, if you are working with Java or C/C++ you can still follow along. Even though we will be demonstrating how to debug your code in an application written in python, the steps for running a debugger are the same for C/C++ and Java.
Before beginning this tutorial, you will need a Grader Than Account and be enrolled in a course that is using the C/C++, Python or Java Workspace Image.
Let’s set up the scenario: let's pretend we have a list of fruits and we want to find if the list of fruits contains any apples. Each time we see an apple we will print out “I found an apple ”. Below is the code we have so far.
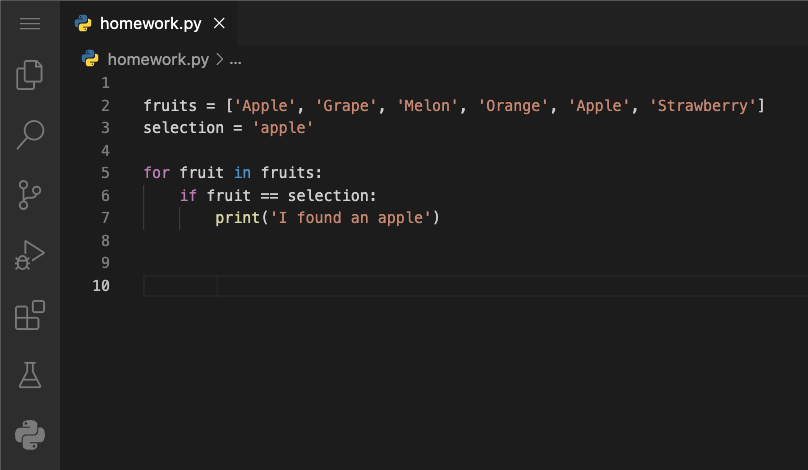
The problem is, when we run our code, nothing is printed to the console. When reviewing the code, you may notice the issue already, but let's use the debugger to figure it out.
Open Run View
To begin to solve this problem, we will need to open the Run View so we can inspect the code while it's running.
1) Open the Run View by clicking the play button with the bug on it 
 in the left most menu bar.
2) Now that the Run View is open, you will see a menu open on the left side of the screen with several new views. We will discuss each view below:
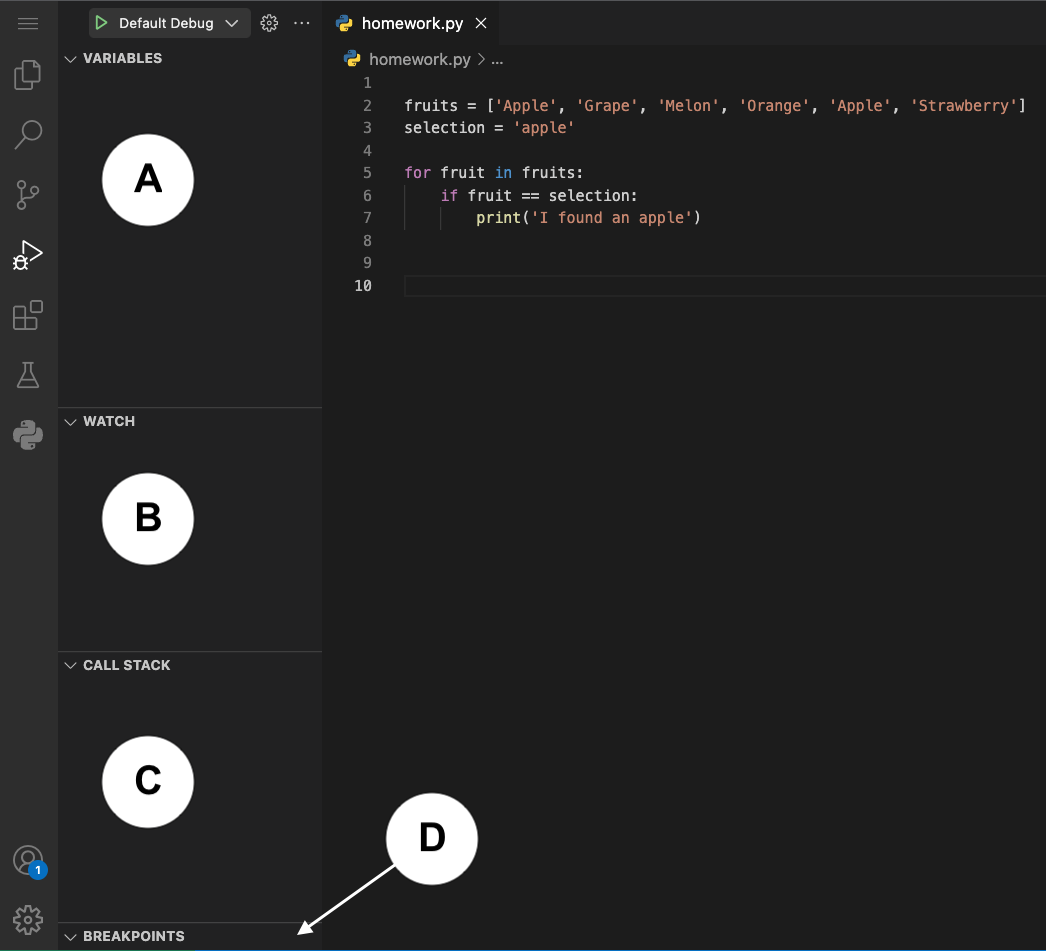
VARIABLES - In this view, we will be able to inspect the current state of the variables within our application. We will be able to pause our application while it is running with a feature known as a breakpoint. Breakpoints allow us to inspect our application by freezing it at a specific line. When it is frozen we will be able to review the variables in this view. In this view we have the capability to edit the variables values too.
WATCH - Variables and expressions can also be evaluated and watched in the section.
CALL STACK - This section will allow us to look at the lines of code that have been called leading up to the pause in our application at the break point.
BREAKPOINTS - This section will display all the breakpoints we have set within our application. We will be able to enable and disable them from here too.
Set a breakpoint
Next, we will learn how to pause our code by setting a breakpoint. A breakpoint is a location in the code where we’d like to pause the application. By pausing the application, we will be able to view the current state of the variables.
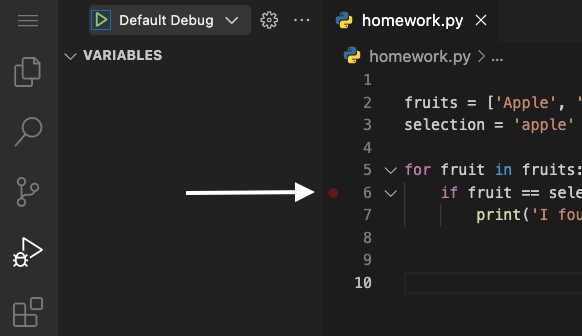
To set a breakpoint at a particular line, click the area between the Run View and the line number. See the image below for more information.
Add the breakpoint before problem code
Tip: it’s often best if you put the breakpoint on a line of code that leads up to the event you expect to happen, not the event itself. For example, we put it on line 6 because this is where the application makes the decision to print the message or not. It is our assumption that there is an issue with the decision making of our application.
Run the debugger
Now that we set the breakpoint on line 6, when we run our application it will pause when it reaches line 6.
Make sure you add the break point
Make sure you add a breakpoint in your code before you run the application, so you can freeze the application and inspect it’s information.
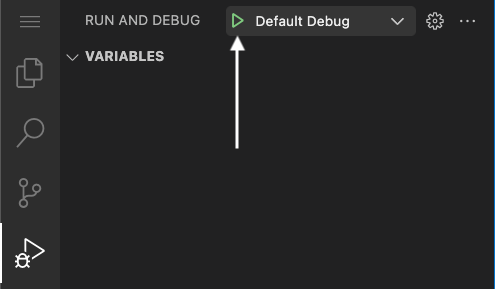
To run the application, we click the green play button in the upper left corner, next to the title “Default Debug”. When you do this, you will notice several new changes on the screen.
Inspecting Our Running Application
Let’s talk about all the changes we see on the screen.
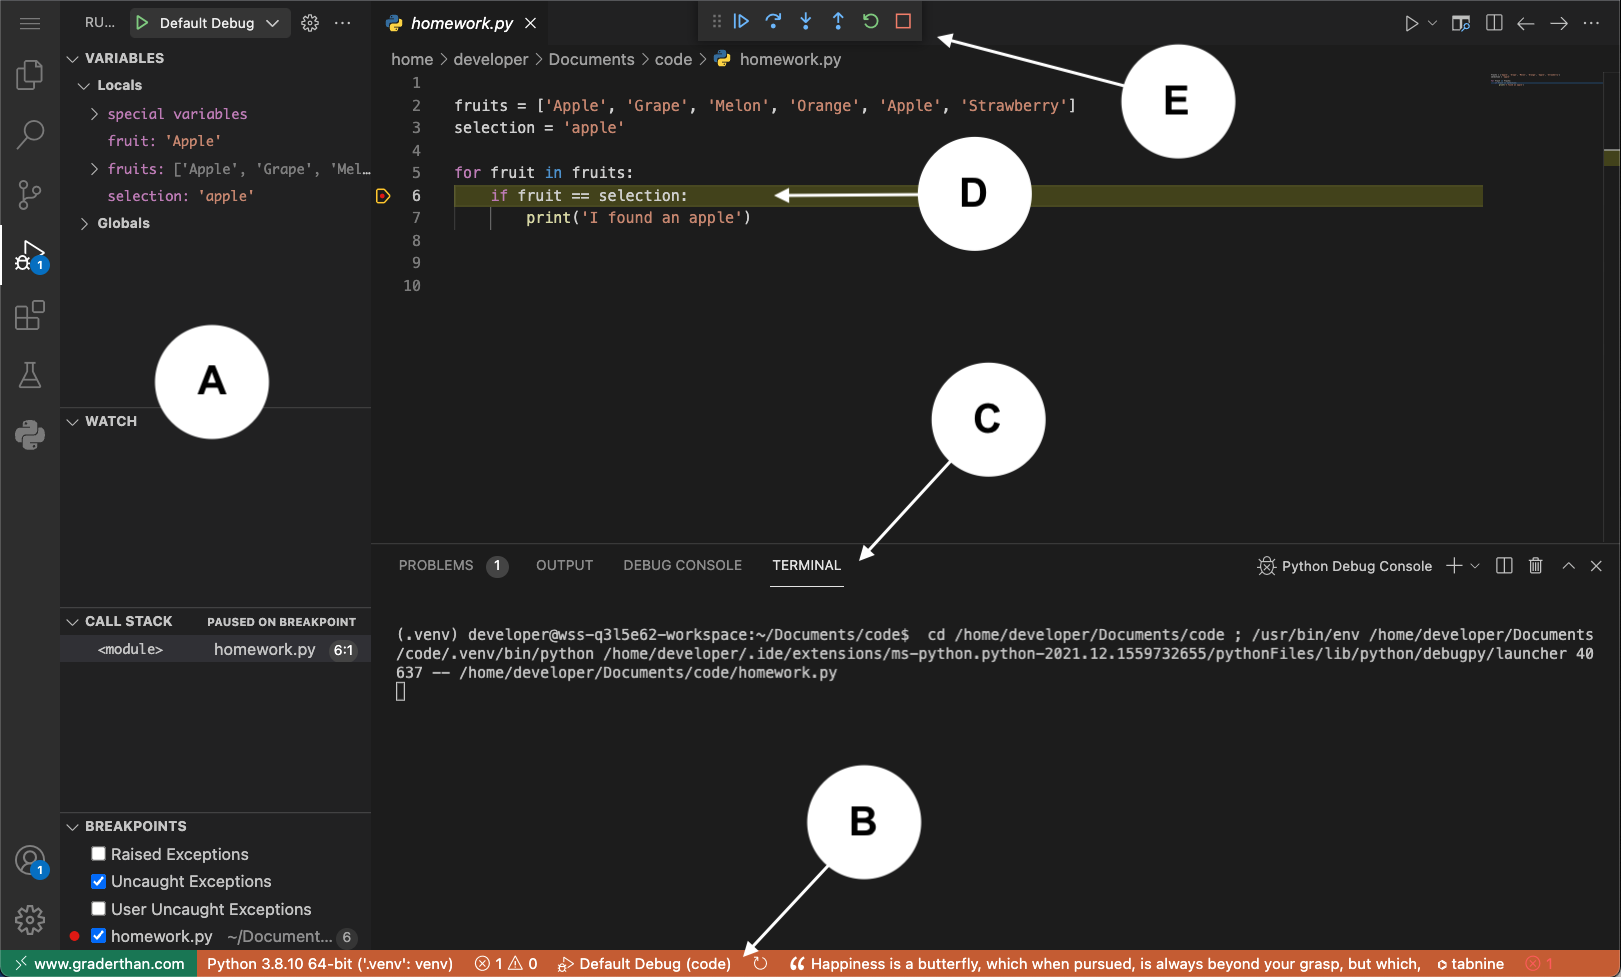
A. VARIABLES - You will notice the variables we declared in our code are displayed in this section. From a quick glance, we can see that the variable “selection” holds the value “apple” but the variable “fruit” holds the value “Apple”. We know that “apple” and “Apple'' are not equal because of the difference in capitalization. Thus, we can understand that the if-statement on line 6 will not print the message. To resolve this bug, we need to change the value on line 3 from “apple” to “Apple”.
By double clicking on a variable’s value in this section, you can modify the value of the variable. Press ENTER, then once you've done so, you are finished editing the value in the VARIABLES view.
B. STATUS BAR - This bar will change color while your application is running to signify that your application is running.
C. TERMINAL - If you find yourself debugging an application that requires user input, you can type information here and view the console output in this section.
D. Breakpoint - When the application stops at a breakpoint, it will highlight the line of code where it is frozen. This signifies that our code is frozen at line 6.
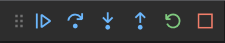
E. Debug toolbar - With this toolbar, we can control the progression of our application.
| Icon | Name | Description |
|---|---|---|
  |
Resume | This continues our application to the next breakpoint or until the end, whichever comes first. It is as if we are watching a movie, we press this button to continue to play the movie until the end or it reaches another break point where it will pause. |
  |
Step Over | This moves to the next line of code. Going back to our movie example, it's as if we are moving to the next frame of the movie. By repeatedly pressing this button you can walk through your code’s execution line-by-line. |
  |
Step In | When you work with functions you can tell the debugger to go into the function’s code. To achieve this, we use the Step In button to go into a function's code, so that you can inspect execution of the application within the function. |
  |
Step Out | If you are debugging a function's code and you want to run the debugger until it leaves the function, we can use the Step Out button to go back to the line that initially called the function. |
| |
Step Out | If you are debugging a function's code and you want to run the debugger until it leaves the function, we can use the Step Out button to go back to the line that initially called the function. |
  |
Restart | This will stop the running application, then start it from the beginning again. |
  |
Stop | This button stops the application. |
From our inspection of the application’s variables in the VARIABLES view (in the last step), we discovered that the variable named selection was not capitalized. This caused our application to be unable to recognize the “Apples” in the fruits list. By switching the value of the variable selection from “apple” to “Apple”, our code now works.
Congratulations on squashing your first bug!
More debugging info
In this tutorial, we have only scratched the surface of the complete capabilities of this IDE’s Debugger. If you want to dive deeper and learn more, please take a look at the official Visual Studio Code Documentation.